Hello, I'm Rick. I'm a student at University of Waterloo. An aspiring software engineer with a focus on machine learning, full-stack development, and financial technologies. I strive to create impactful digital experiences from idea to reality.
I am seeking a co-op position for Summer / Fall 2026!
My projects
MindGo
Made with:
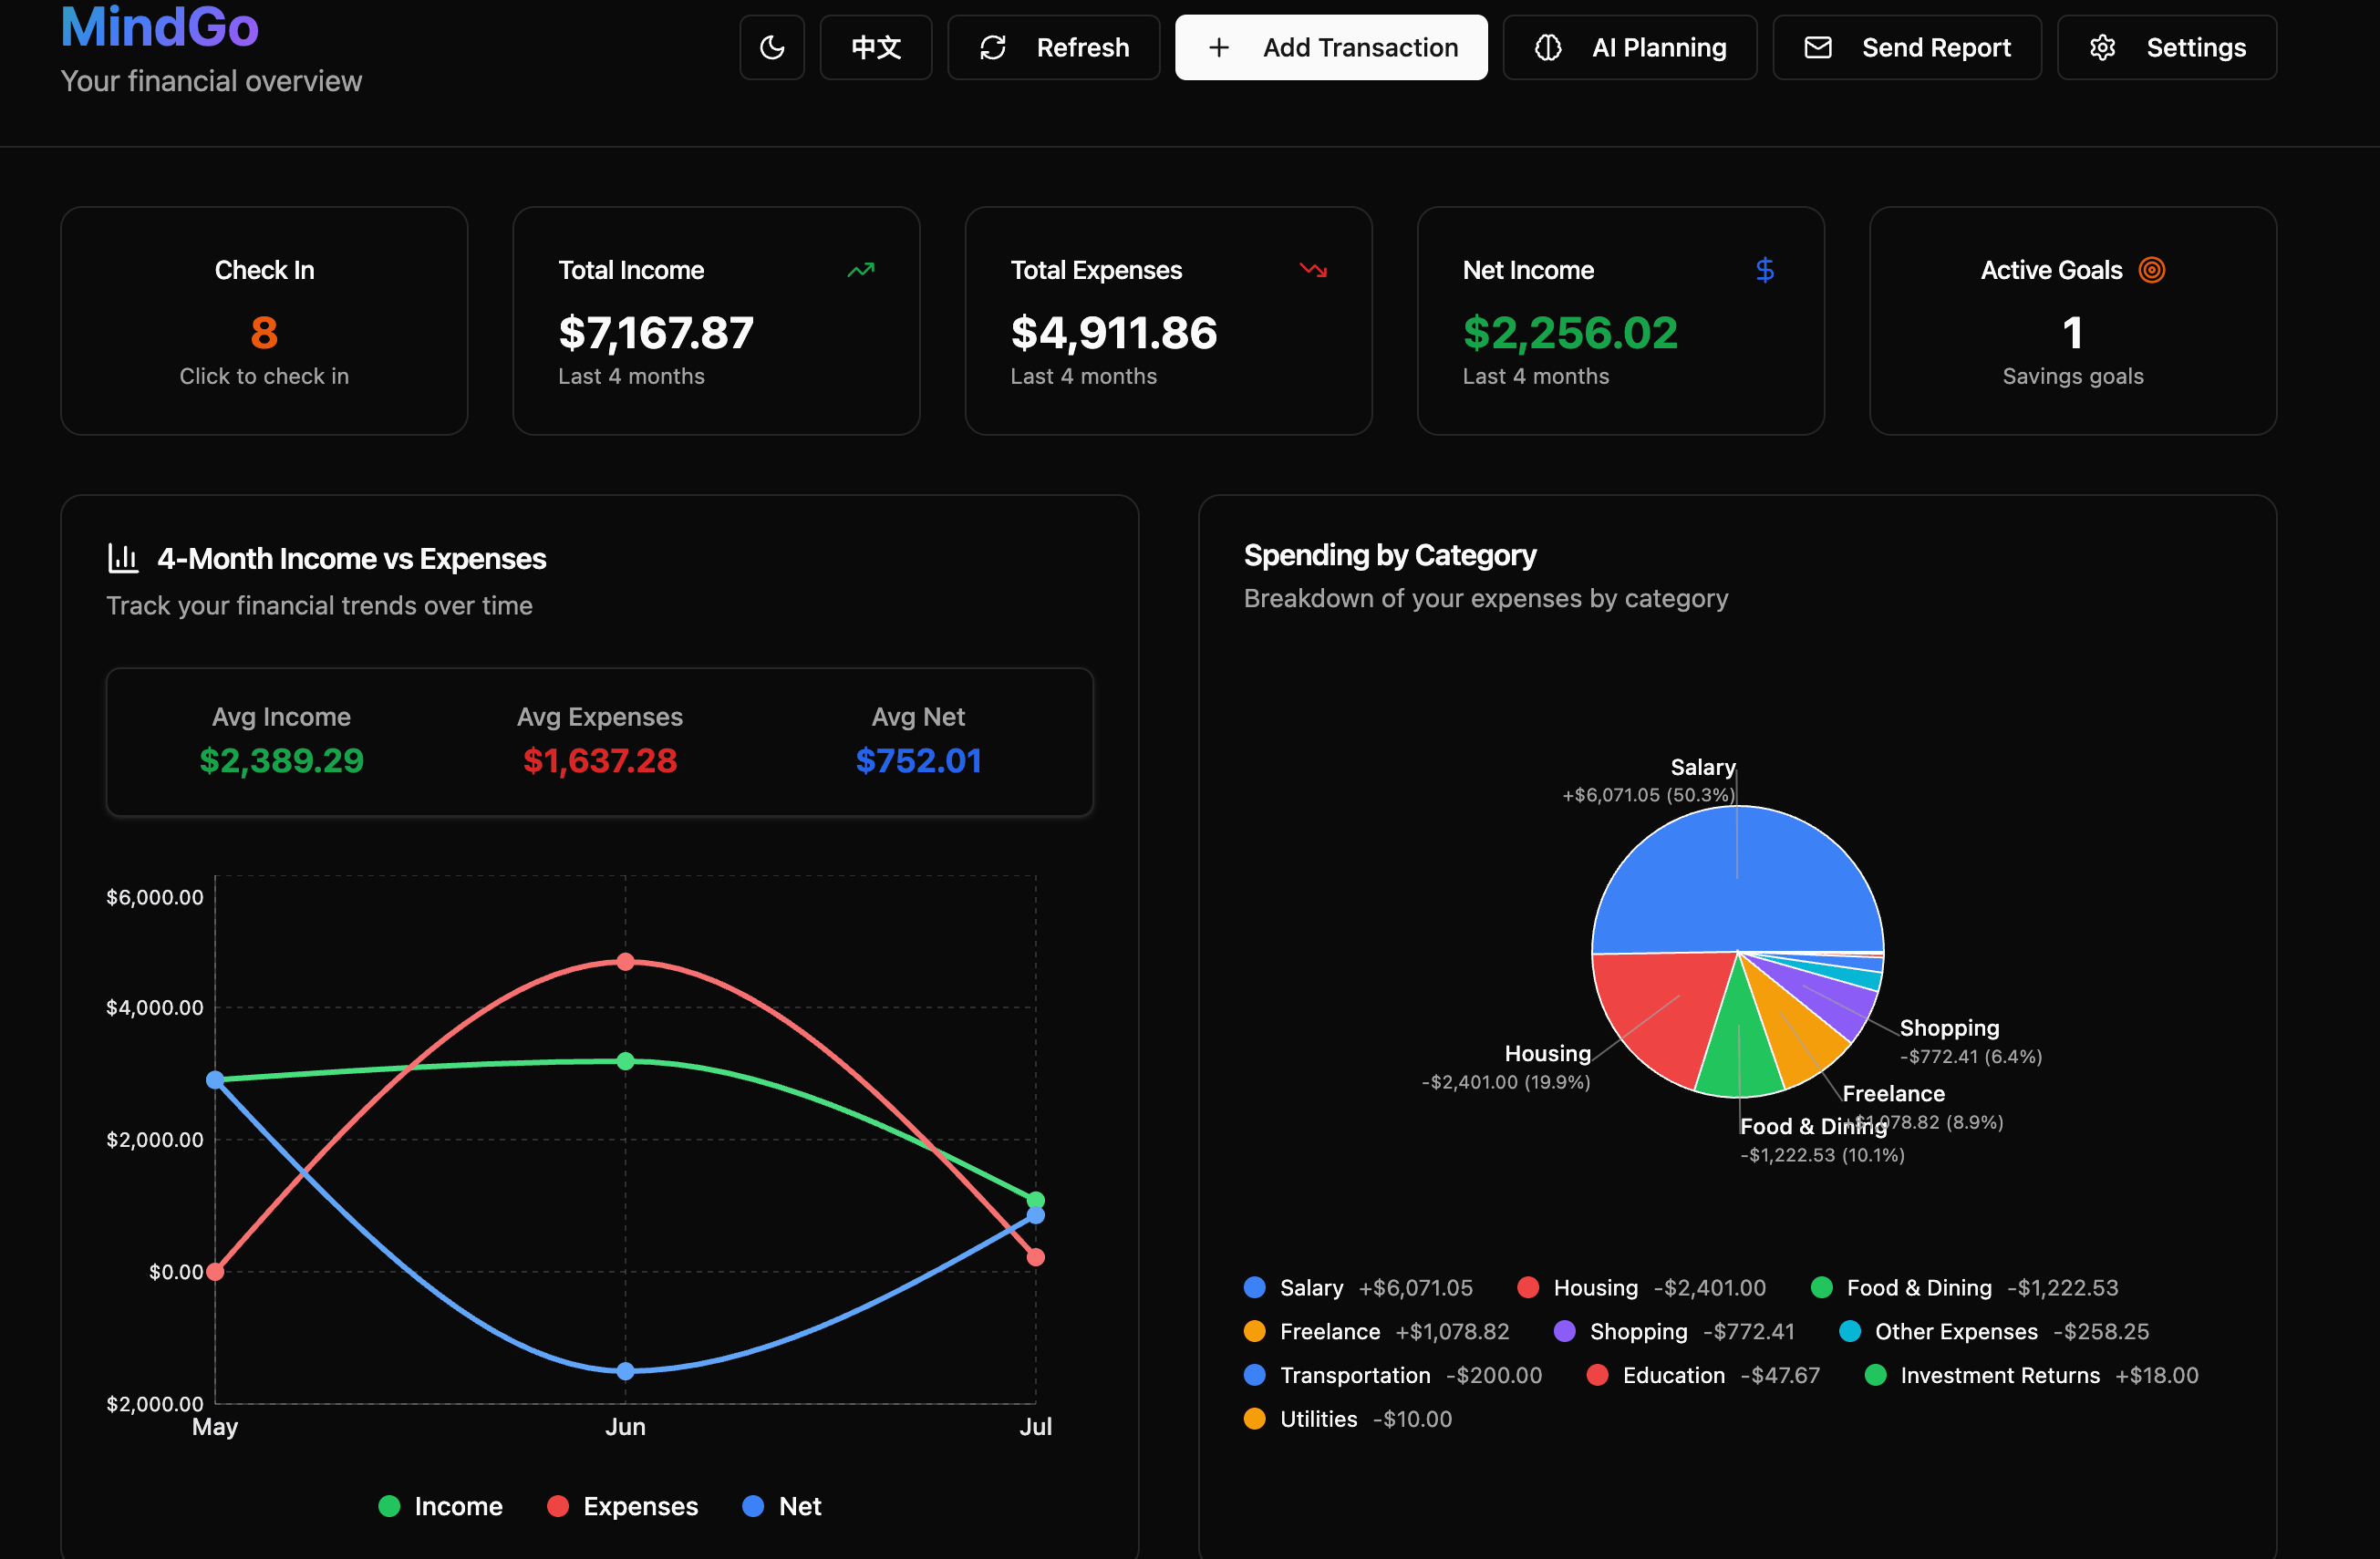
AI-powered personal finance companion serving 1,000+ users worldwide, offering real-time expense, income, and investment tracking. It features multi-currency support, automated reports, and an English/Mandarin UI. Integrated with Finnhub, Alpha Vantage, and Binance to provide live stock charts, crypto trends, and AI-driven purchasing suggestions, the app also delivers personalized financial plans, savings goals, and weekly email reports powered by GPT-4o via OpenAI API.
AI Sentiment Pulse
Made with:
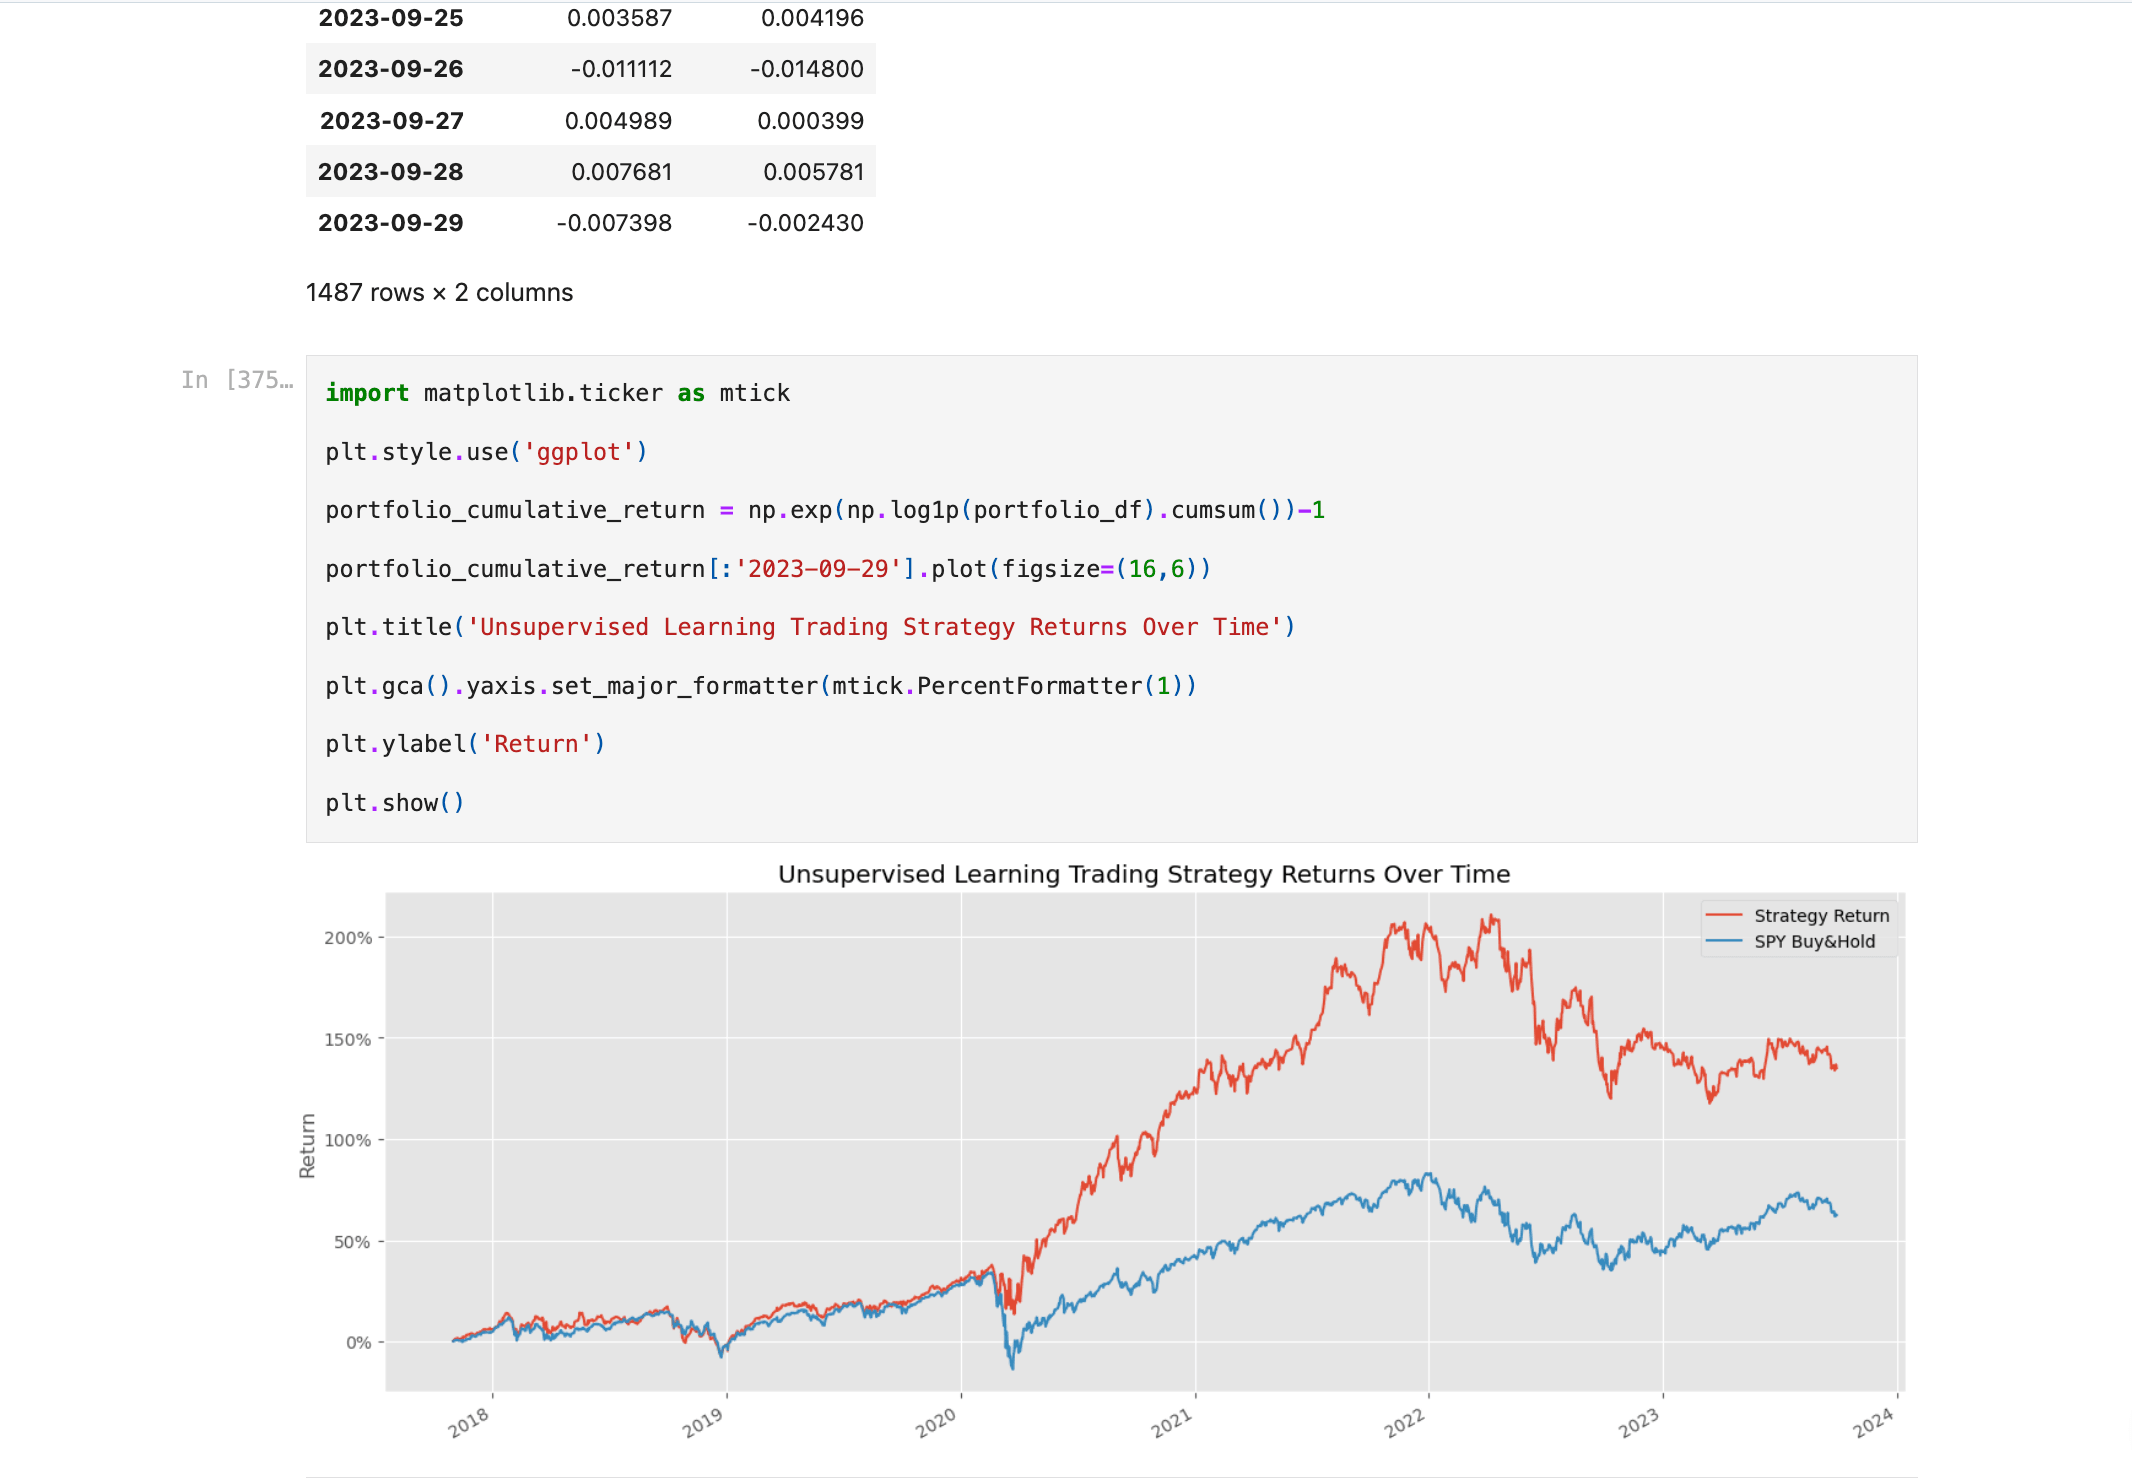
Collaborated in a 9-member WAT.ai team to build an AI-driven market sentiment analytics system, fine-tuning DeBERTa-v3 Transformer models for sentiment and sarcasm detection. Aggregated model outputs using unsupervised statistical methods to produce real-time sentiment signals from social media, and integrated financial data APIs to correlate sentiment trends with stock performance, generating actionable insights for trading strategies.
SlopFish
Made with:
Modified the Stockfish chess engine to create Slopfish, a forced-capture variant engine running on a single-core, multi-threaded CPU. Implemented engine-level changes in C++, used Polyglot for opening book format conversion to ensure XBoard compatibility, and trained a variant-specific NNUE using GPU acceleration. Leveraged Minimax with Alpha-Beta pruning for move selection and Zobrist hashing for efficient board state representation.
AGE Game Engine
Made with:
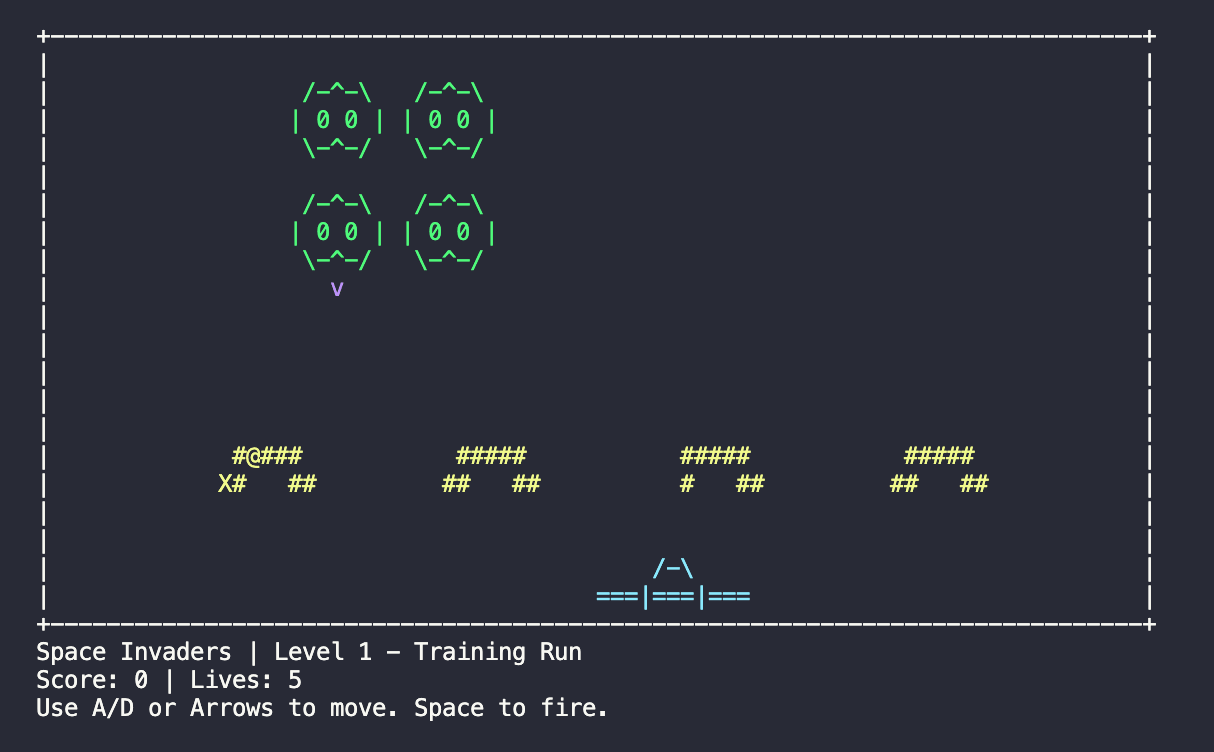
Architected a C++20 module-based MVC game engine for 2D ASCII games, currently supporting Space Invaders and Snake. Implemented core engine systems including rendering, input handling, game loop management, and collision detection. Designed a flexible Entity-Component System (ECS) for modular game object management, enabling easy extension with new entities and behaviors. Games inherit from a base GameEngine class and implement virtual methods for game-specific logic, streamlining new game development.
WatRent
Made with:
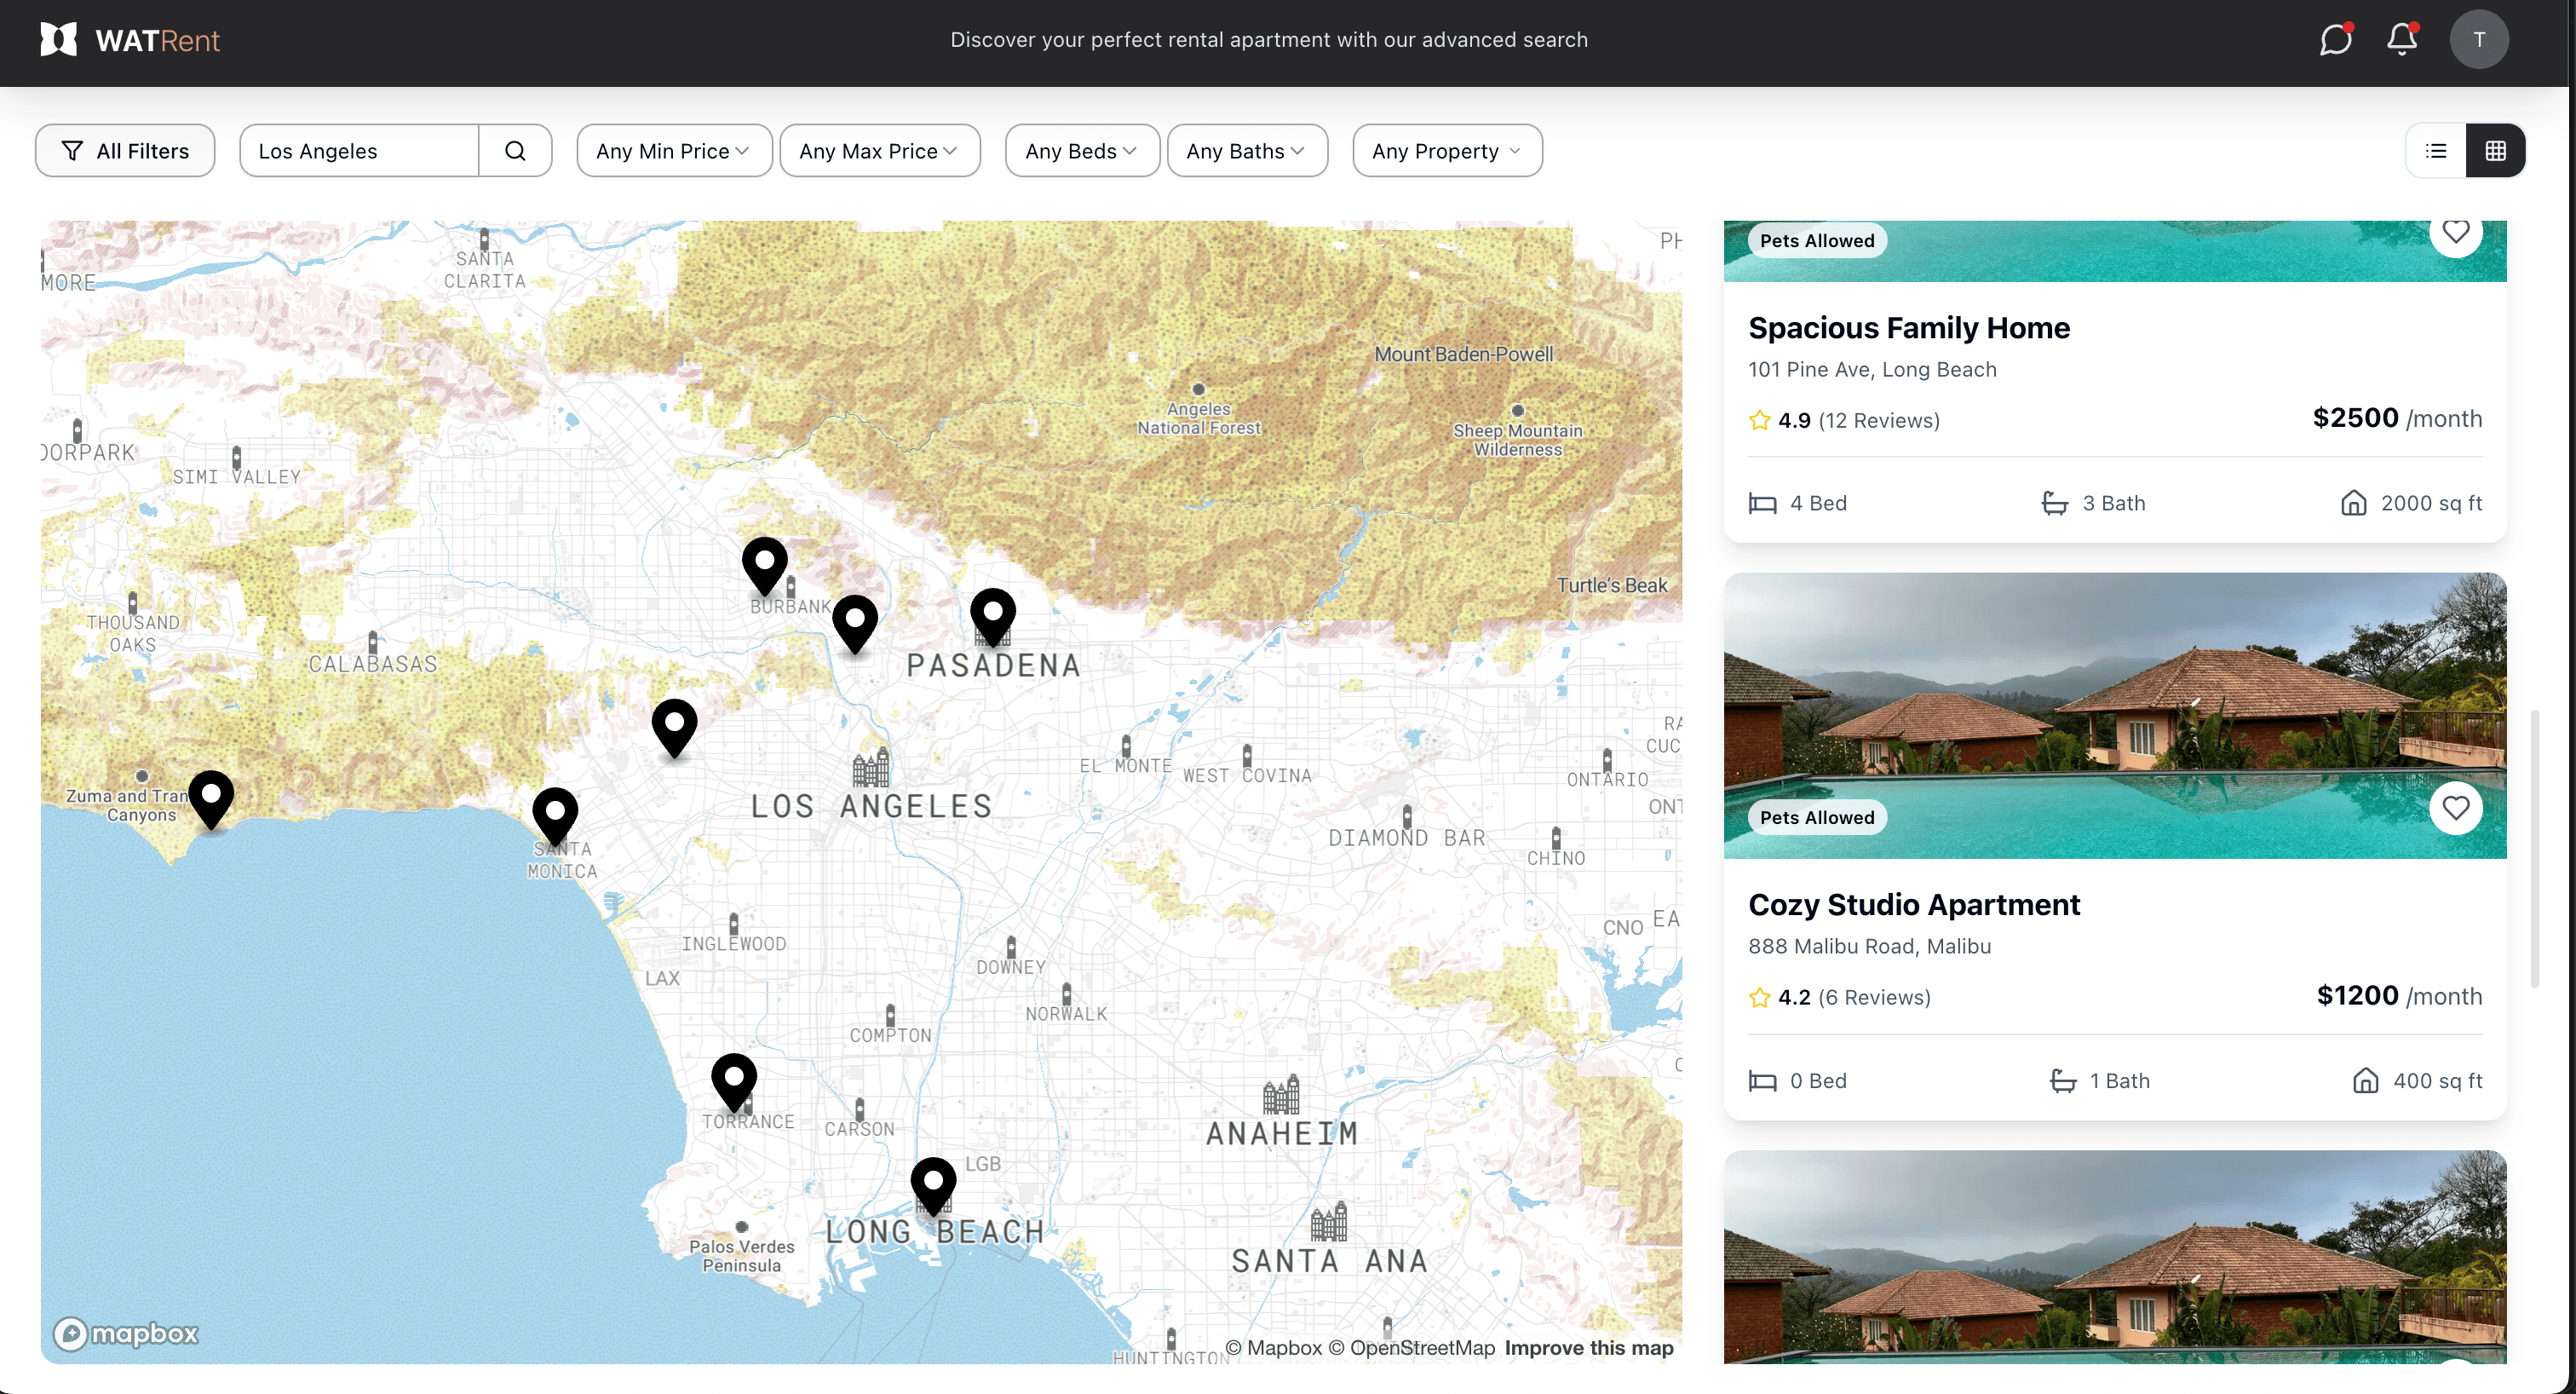
Enterprise-grade rental platform progressing toward full deployment, delivering a production-ready solution for apartment listings and rental workflows. It features a secure AWS-based cloud architecture with S3 for image storage, Cognito authentication, and Amplify for CI/CD, along with a RESTful API backend on EC2 with API Gateway and RDS. Integrated with Mapbox for interactive property visualization, the platform offers dedicated Renter and Manager interfaces—renters can browse, save, and apply for listings, while managers post, edit, and manage applications.
Moros
Made with:
Single-player 2D story-driven puzzle adventure game developed in a team of 8 during GitHub & itch.io Game Jam 2024, ranking #246 out of 5,000+ participants. Built with Unity and C#, the game features responsive input systems, puzzle mechanics, and player abilities like hiding during boss fights, alongside dialogue systems for immersive storytelling. Performance was optimized for input responsiveness, frame rates, and complex sequences, ensuring smooth gameplay.
Kitchen Chaos
Made with:
Single-player 3D cooking game built with Unity and C#, featuring immersive kitchen environments, interactive elements, and responsive UI for smooth gameplay. Designed multiple game themes with seamless transitions, implemented customizable controls with controller support, and developed systems using Object-Oriented Programming (OOP) principles to ensure clean code structure and high performance.
SaaS Template Application
Made with:
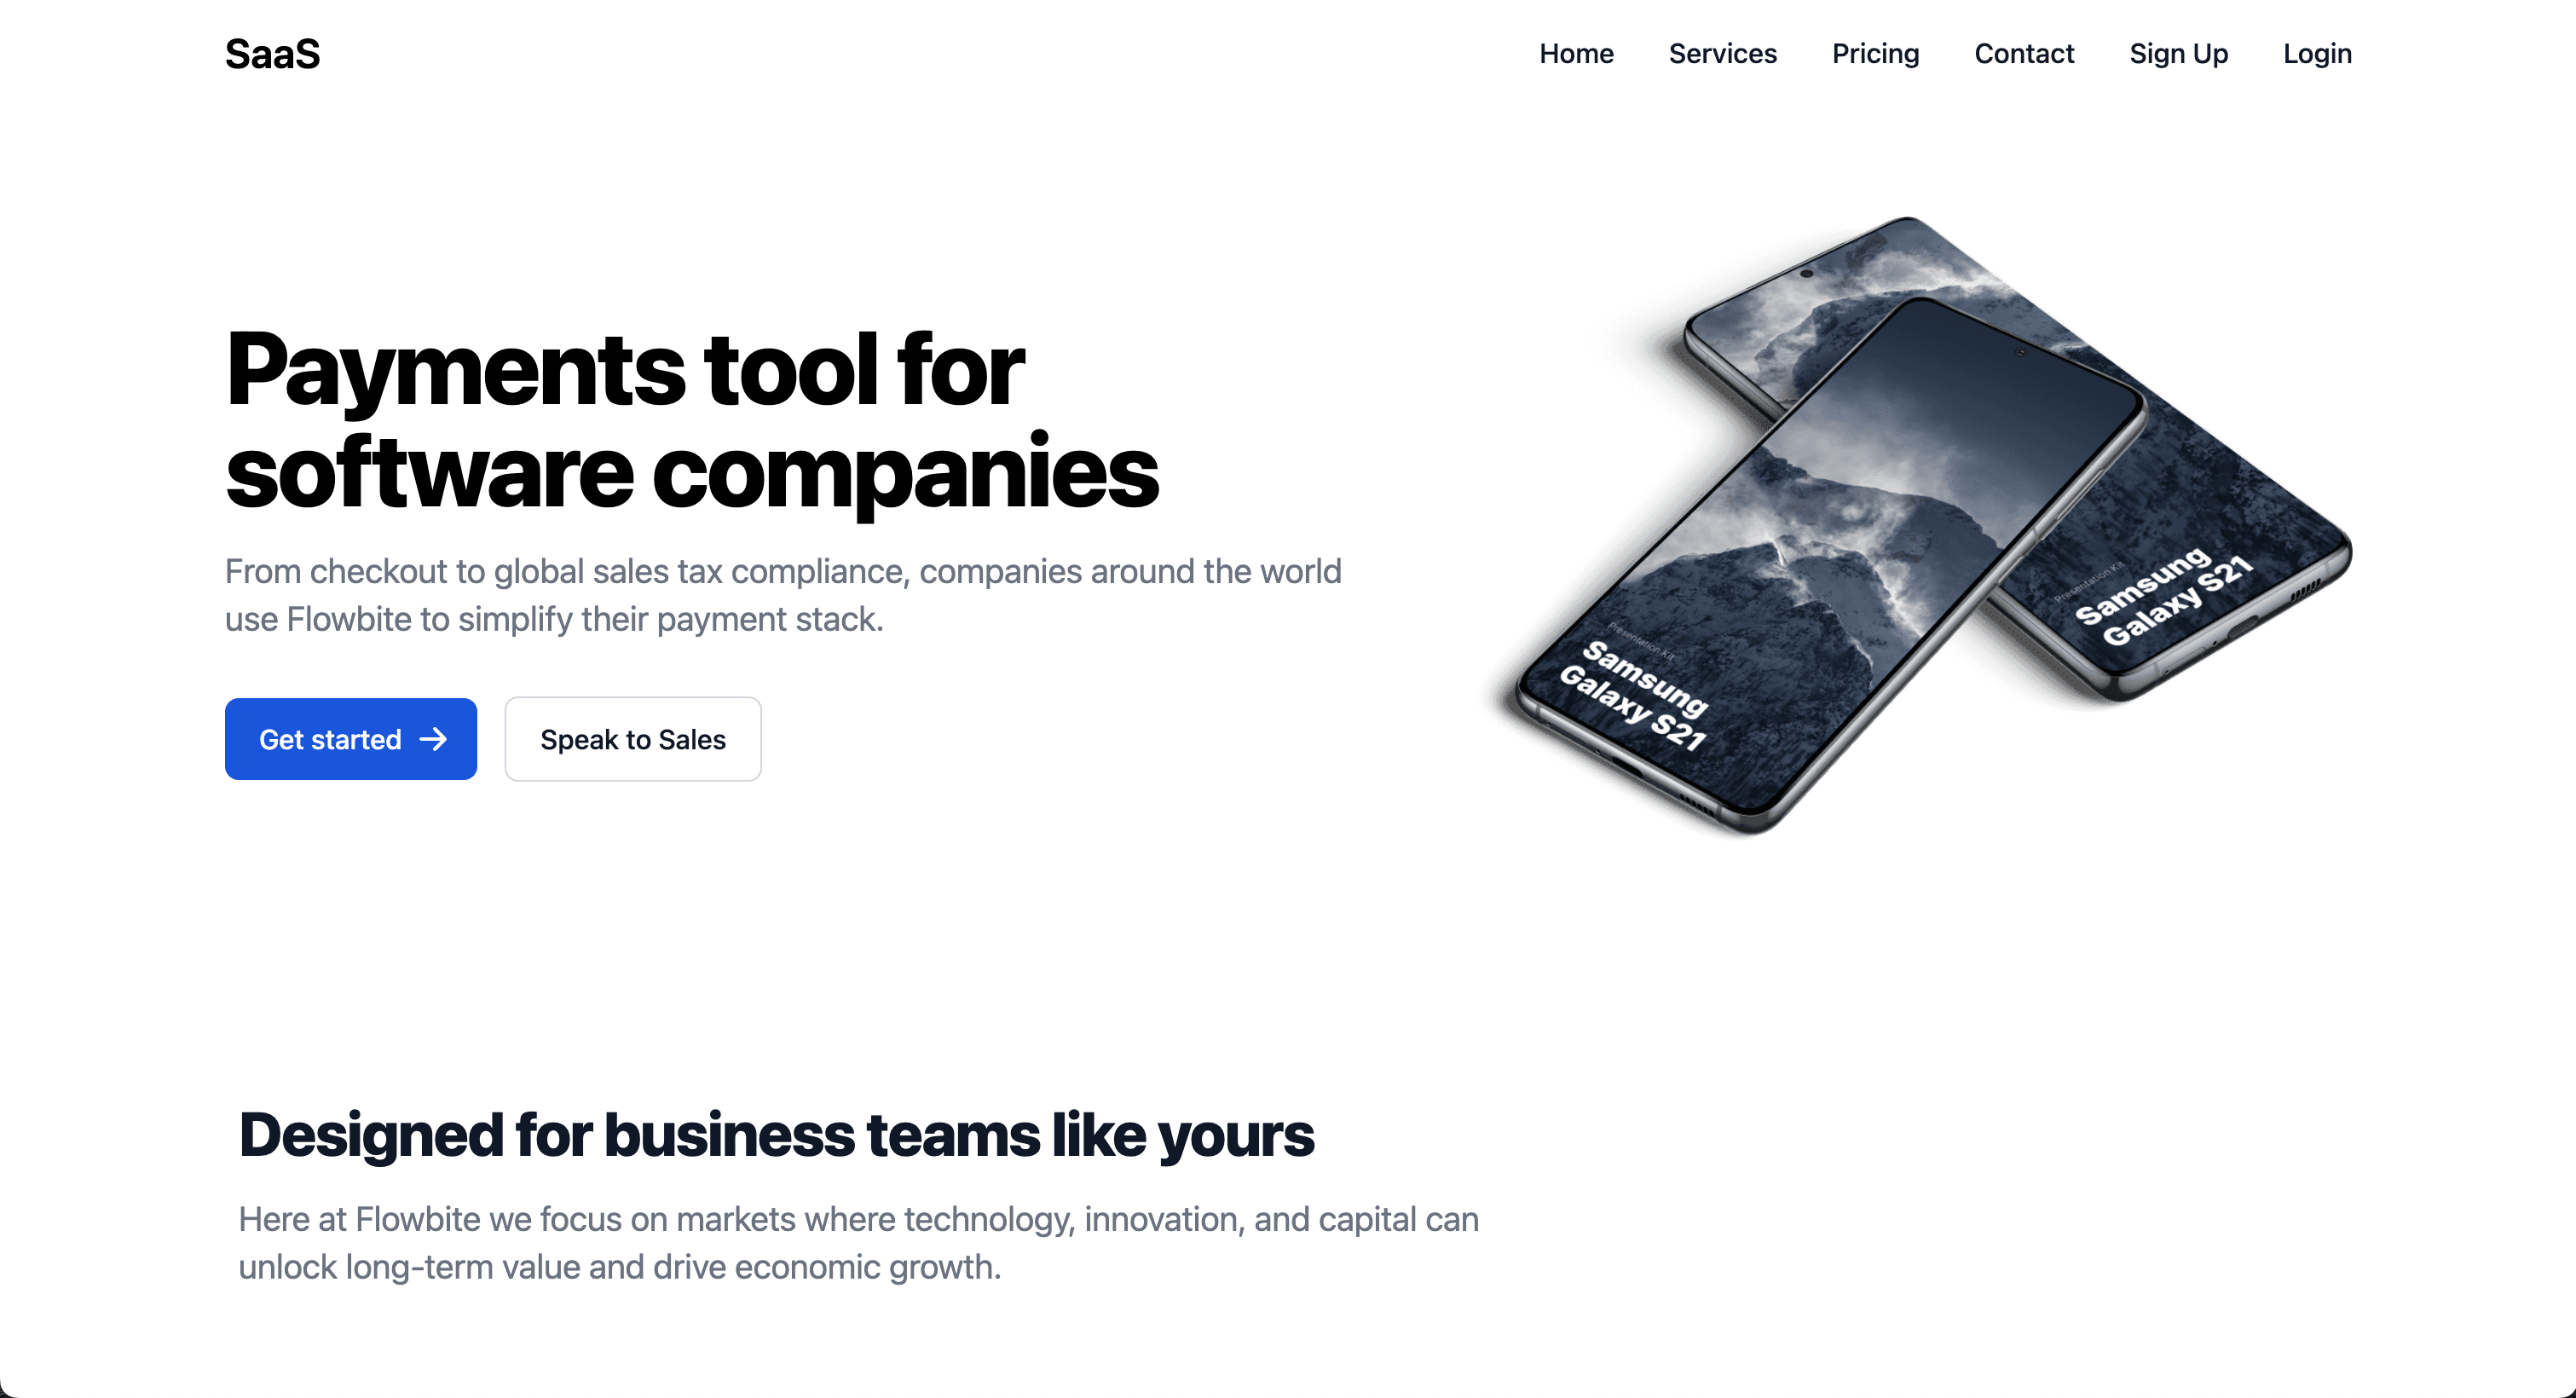
Features essential SaaS components like checkouts, subscriptions, dashboards, customer profiles, and a landing page for streamlined service management. Full-stack solution with Django for backend, TailwindCSS for frontend, and Neon for database management, deployed on Railway. It includes payment integration via Stripe API for one-time and subscription billing, containerization with Docker, and CI/CD automation through GitHub Actions.
PriceValve
Made with:
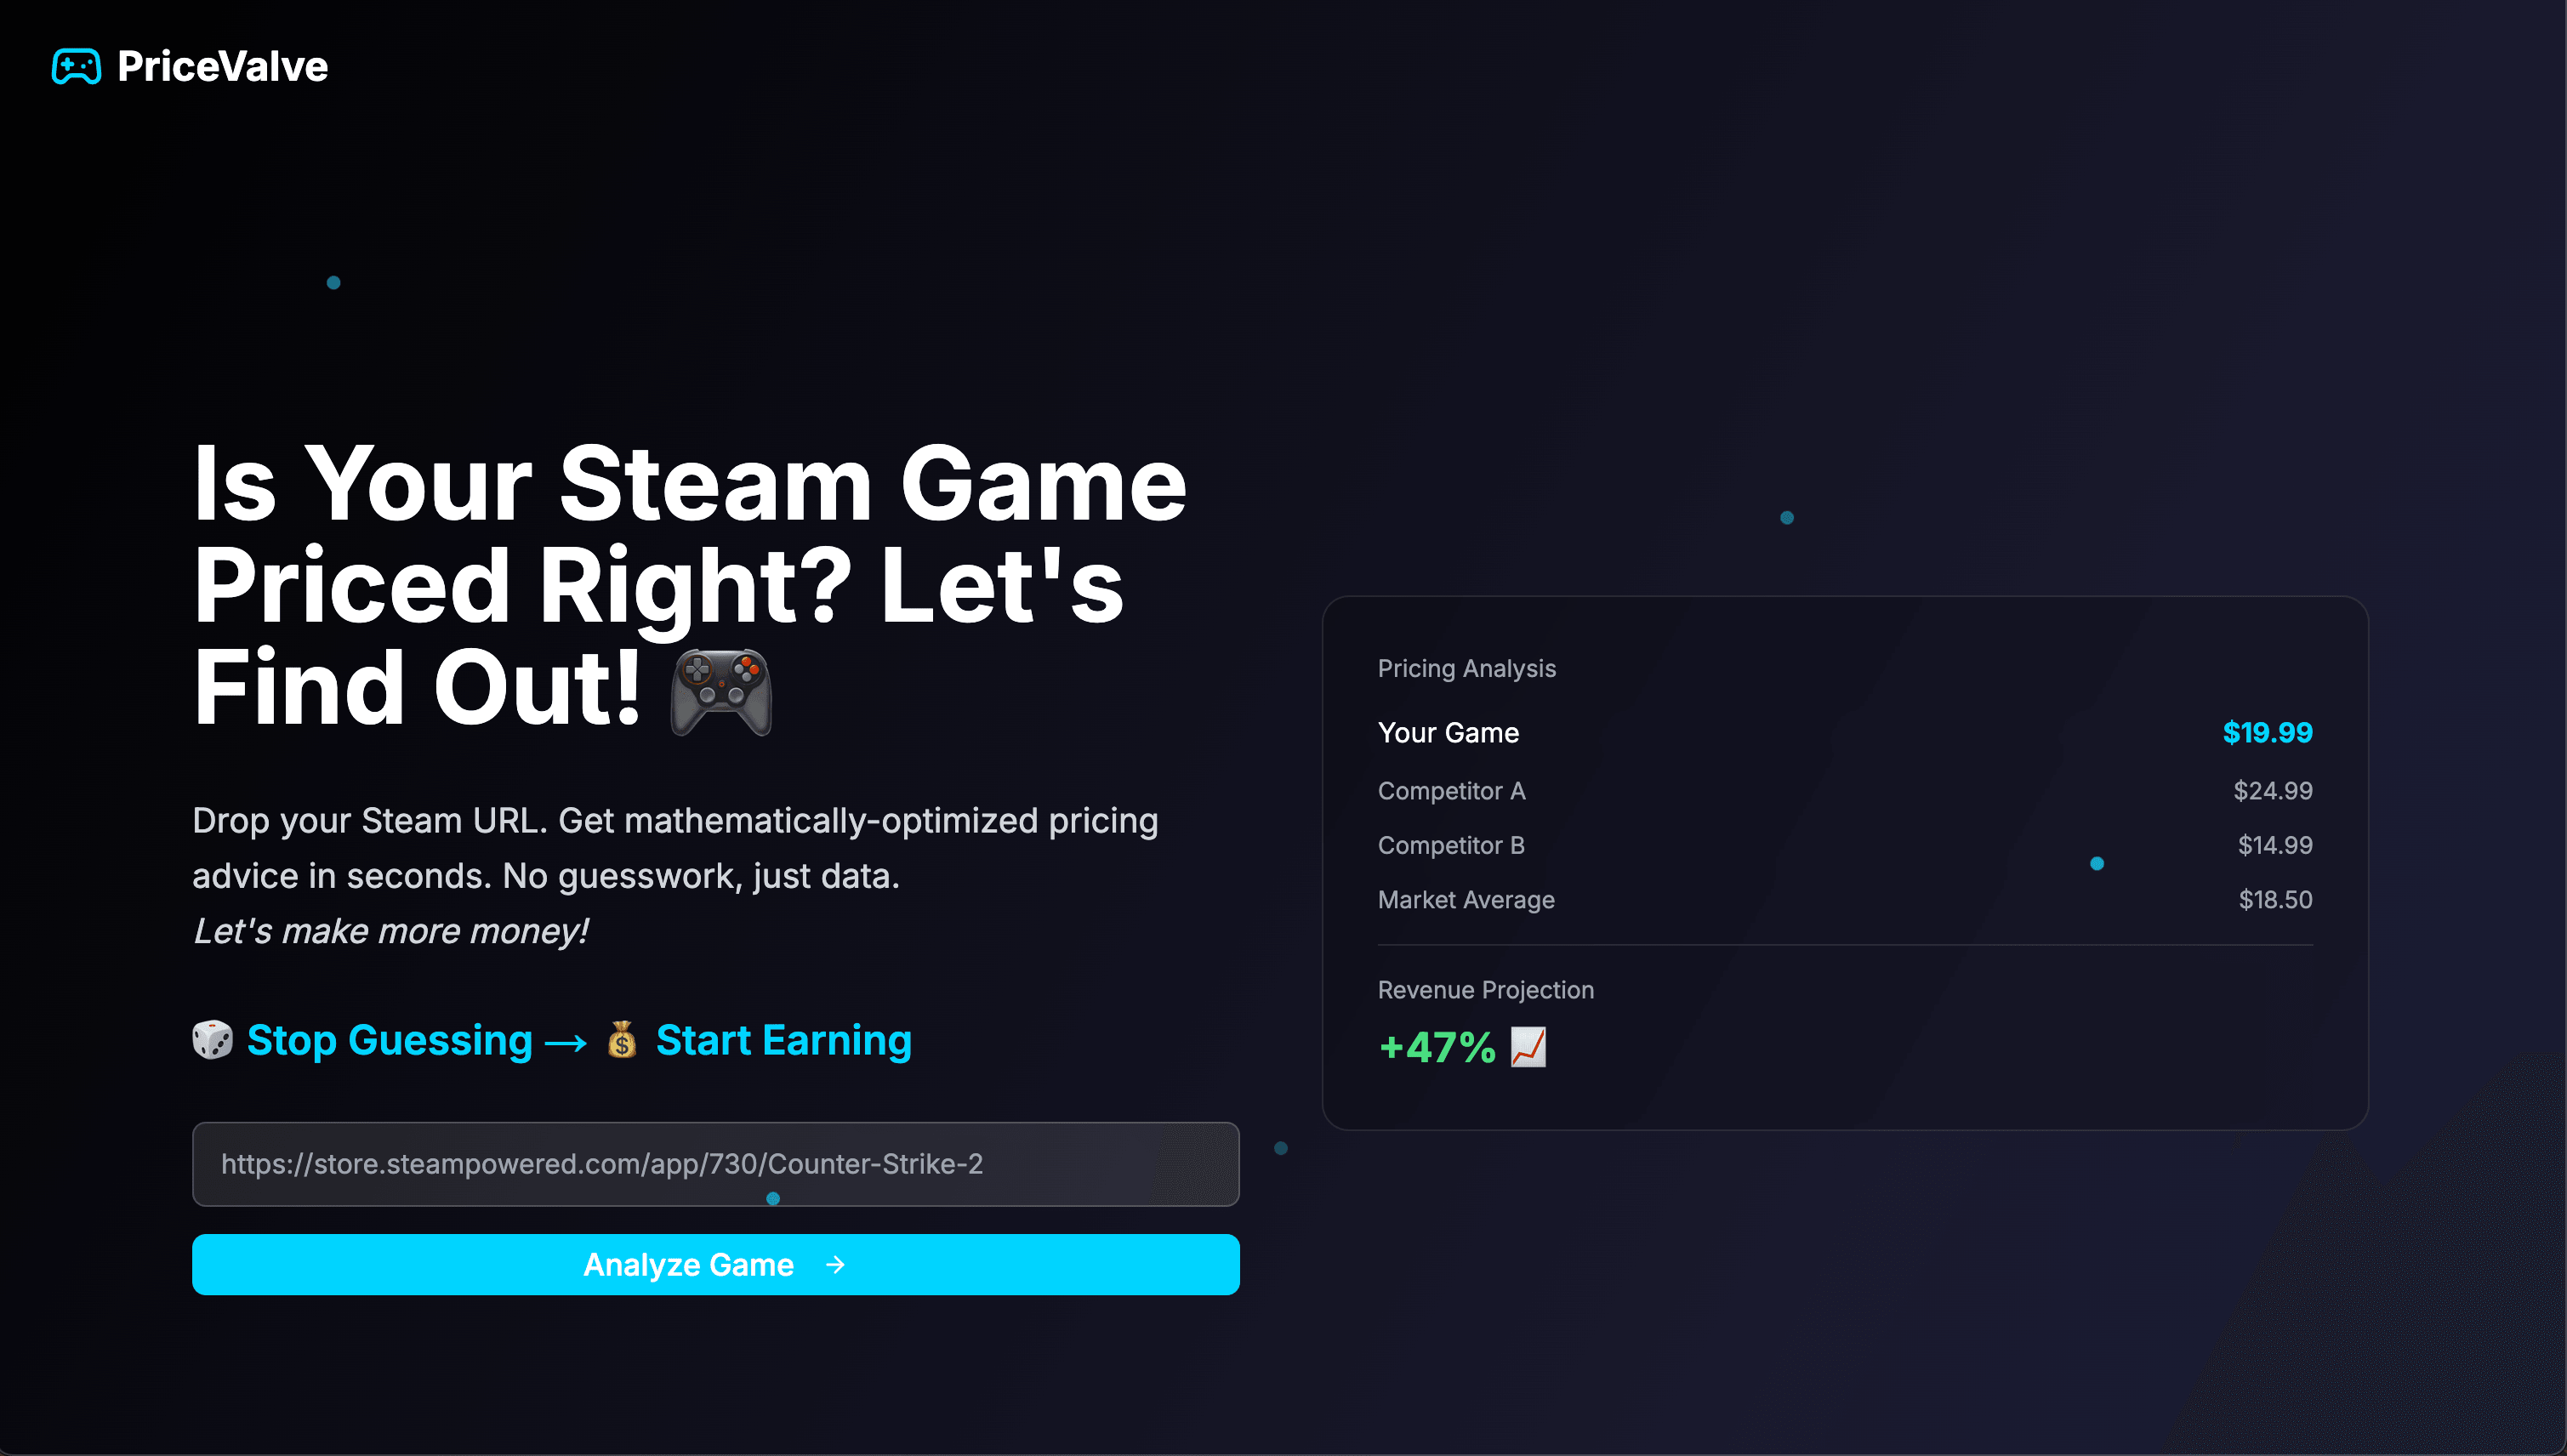
Open-source platform built at SpurHacks 2025 to help Steam developers optimize revenue through real-time data ingestion, sentiment analysis, and competitor benchmarking. It integrates Steam Web API, SteamSpy, and ITAD to deliver interactive dashboards with live charts and a custom Revenue Optimization Engine that generates confidence-scored pricing and timing recommendations based on demand models, sentiment trends, and cluster-based competitor analysis.
My Skills
- C#
- C++
- C
- Python
- TypeScript
- Go
- Rust
- Node.js
- Express.js
- FastAPI
- Django
- SQL
- PostgreSQL
- MongoDB
- JavaScript
- React.js
- Next.js
- Vue.js
- Redux
- HTML5
- CSS3
- Tailwind CSS
- AWS
- Azure
- Docker
- Kubernetes
- GitHub Actions
- Linux
- CI/CD
- Infrastructure as Code
- Pandas
- Numpy
- PyTorch
- Hugging Face
- Matplotlib
- Scikit-learn
- R
- Git
- Visual Studio Code
- Jupyter Notebook
- Unity
My experience
Software Developer
Rocket
Member of Rocket Innovation Studio, working on the Rocket Close's Title Team to develop Windows desktop applications using C# and .NET in an agile environment.
January 2026 – April 2026AI Developer
University of Waterloo
Built an AI-powered job ingestion and recommendation pipeline in collaboration with Microsoft Canada, designing a KNN-based classifier using Cosmos DB Vector Search, and developing full-stack portal services (resume search, profile-based recommendations, InStage integration) supporting 42,500+ users per term.
May 2025 - August 2025AI Developer
Inspur Group Co., Ltd.
Developed RAG-based AI services with OCR pipelines and FastAPI/MinIO workflows, improving document processing accuracy and reducing error rates by 30%.
September 2024 - December 2024Cross-Border Trade Assistant
Jiangsu Baiheng Energy Saving Technology Co., Ltd.
Built and launched a Shopify e-commerce site while supporting cross-border trade initiatives; earned AI training certification in Shenzhen and facilitated internal training sessions for colleagues.
June 2023 - September 2023My Education

Bachelor of Mathematics
University of Waterloo
2023 - 2028
- Major in Computational Mathematics
- Major in Statistics
- Minor in Combinatorics and Optimization
- Minor in Computing (Computer Science)
- Activities: WAT.ai club member working on AI-driven stock market sentiment analysis (Sentiment Pulse); Basketball Intramurals
Contact me
Please contact me directly at m69liu@uwaterloo.ca or through this form.
